Unlocking the Power of Infographics: A Comprehensive Guide"
The first statistical graphs as we know them today were created by William Playfair in his 1786 book The Commercial And Political Atlas, although some historians argue there are cave paintings in the Serra Da Capivara caves in Brazil with similar features to many modern infographics that date from as far back as 25,000 years ago
The Importance of Infographics in Conveying Complex Information
Infographics are valuable tools for conveying complex information in a visually appealing format. They offer several benefits, including:
- Improving Decision-Making: Infographics help process information faster, aiding in quicker decision-making
- Increasing Exposure: They enhance content exposure by presenting data in a visually appealing and engaging manner, making it more shareable and relevant to the audience
- Enhancing Readability: Infographics make text-heavy content easier to digest and understand, improving overall readability and knowledge retention
- Showcasing Product Value: They effectively highlight key features, demonstrate product functionality, showcase benefits, provide social proof, compare with competitors, simplify complex data, and illustrate use cases to communicate product value effectively.
- Boosting Marketing Efforts: Infographics help reach a wider audience, increase social media shares, improve SEO, attract attention, and build brand awareness
In conclusion, infographics are powerful tools that not only simplify complex information but also engage audiences effectively, making them an essential component of any marketing strategy.


Why Use Infographics?
Memorable Marketing
Research indicates that 65% of brands utilise infographics for marketing due to their eye-catching, colourful nature that conveys information in a memorable and concise manner. Colourful marketing materials can significantly enhance attention span, recall, and brand recognition by over 80%.
Sales Boost
Infographics have the potential to boost sales significantly. For instance, studies have shown that using colour in infographics can lead to an 80% increase in sales compared to black and white designs. Their visually appealing nature makes them an easy way to make advertisements and presentations more impactful.
Social Media Engagement
Incorporating visuals in online marketing, especially alongside SEO strategies, enhances social media presence. Infographics are particularly effective in generating social media shares and driving traffic to websites, ultimately aiding in brand building and increasing awareness among target audiences.
In essence...
Infographics not only capture the audience’s attention but also sustain it effectively. By presenting data in an enjoyable and easy-to-read format, infographics can enhance social media reach, engagement, and the likelihood of content going viral online.
Testimonials

Each infographic has performed well on social media, and produced additional social media shares and backlinks for each client. I will definitely continue to use Eleanor and her team for infographics and other designs in future."

Types Of Infographics
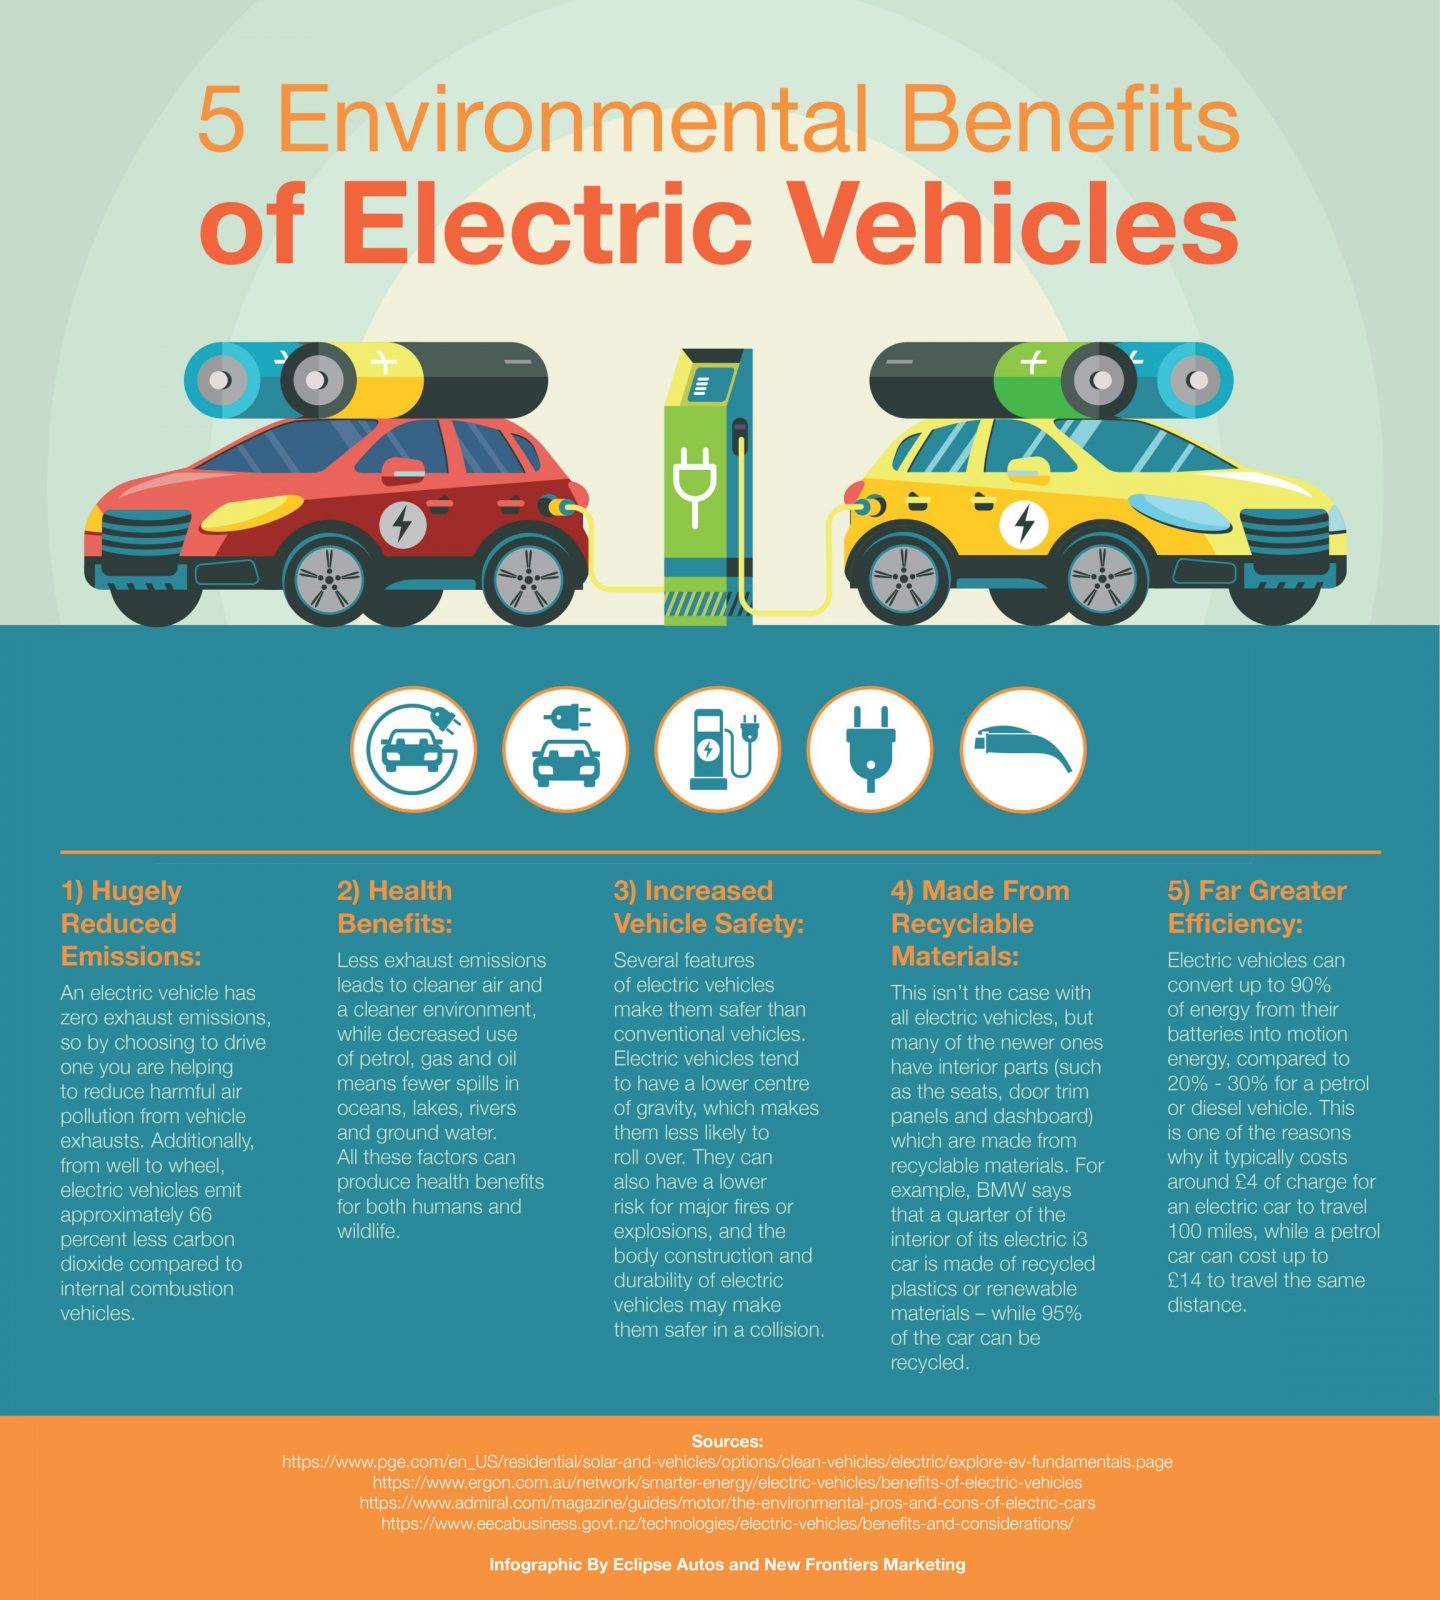
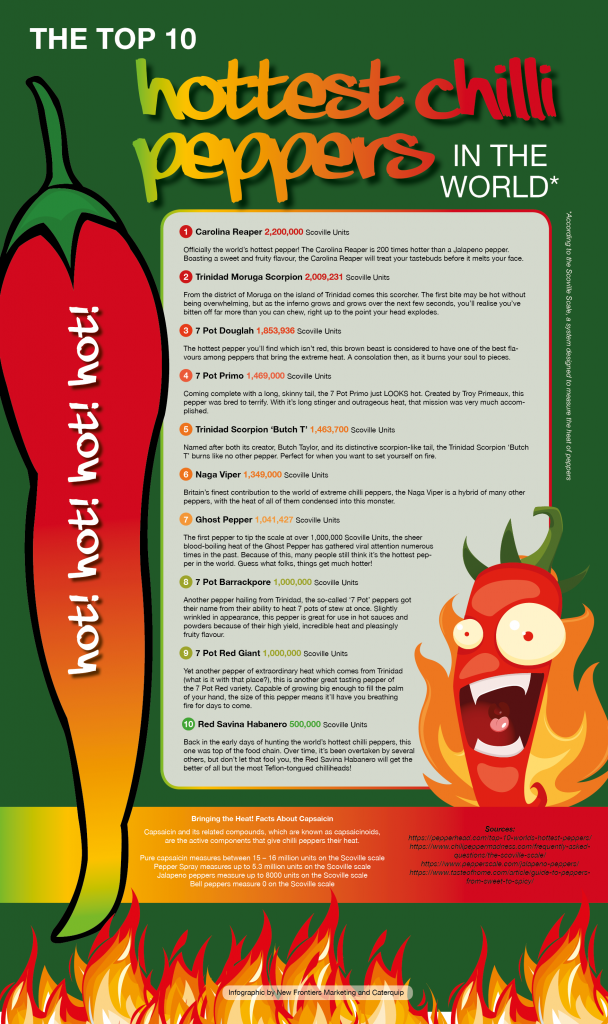
The following diverse types of infographics cater to different needs, from simplifying data with single charts to providing detailed instructions with instructional diagrams and enhancing engagement with mixed-chart infographics.
Single Charts
- Include bar and line graphs.
- Simple visualisations of data, easily recognised and interpreted.
- Ideal for formal settings like corporate presentations and sales pitches.
Flow Charts
- Begin at a starting point and analyse subsequent actions to predict outcomes.
- Useful for decision-making, process documentation, and improvement.
- Display processes visually to enhance comprehension.
Timelines
- Visual representations of events or processes over time.
- Provide a chronological view of information.
- Useful for showcasing historical data or project timelines.
Mixed-Chart Infographics
- Incorporate various chart styles representing different data types.
- Visually engaging and attention-grabbing for viewers.
- Icons may be used to emphasise and clarify statistical points.
Instructional Diagrams
- Step-by-step guides on how to use a product or service.
- Clearly illustrate actions needed for successful product utilisation.
- Enhance user understanding compared to text-only instructions.
Photographics
- Combine data and photography to create visually appealing presentations.
- Clearly explain data through engaging visual elements.

Frequently Asked Questions
What is an infographic?
An infographic is a visual representation of data or information, designed to make complex information easy to understand and digest. It usually consists of graphics, charts, and other visual elements to help convey the message.
What are the benefits of using infographics?
Infographics are effective because they make it easier for people to understand complex information quickly. They can also help to increase engagement, as people are more likely to share and remember visual content. Infographics are also versatile and can be used for a variety of purposes, such as marketing, education, and storytelling.
What makes a good infographic?
A good infographic is visually appealing, easy to read, and effectively communicates the intended message. It should be well-designed and use appropriate colors, fonts, and graphics to enhance the information being presented. It should also be relevant and provide value to the audience.
What data can be turned into an infographic?
Any data that can be visualised can be turned into an infographic. This includes numerical data such as statistics, percentages, and trends, as well as non-numerical data such as concepts, ideas, and processes.
How can I promote my infographic?
To promote your infographic, you can share it on social media, include it in blog posts, and submit it to infographic directories. You can also reach out to influencers and ask them to share it with their followers. Additionally, you can use paid advertising to promote your infographic to a wider audience
Create Your Design
Related Services
Design
Torquay Graphic Design - At Quay Media in Torbay, we specialise in all forms of graphic design. Good graphic design is an important part of communicating your message, and in attracting the right customers.
Web Design
Torquay Website Design – Quay Media are a local Torquay company who cares about bespoke designed websites for what ever your needs are. We offer packages to suit all, from simple portfolio websites to large Ecommerce websites.
Branding
A well-designed logo is the key to your business’ success; it exudes professionalism, adds quality and credibility, and makes you stand out from the competition.
We'd love to hear from you
Contact Us
We have many different packages, so please contact us to find out more!
For more contact information click here.

